Column statistics display a breakdown of statistics for a selected column in the data flow. Depending on the chosen column, you may also see suggested data prep actions.
Open Column Statistics
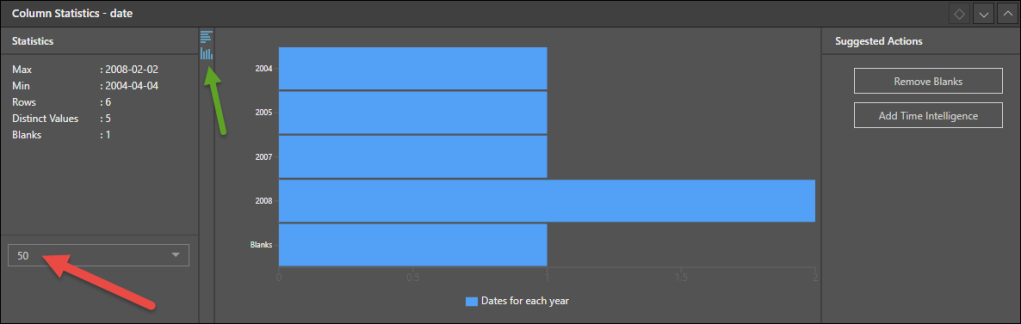
Access Column Statistics from the Datasource Preview panel; click bar chart icon (green arrow above) at the top of the relevant column to open its Statistics panel.
The Column Statistics Panel
In the first panel you'll see a breakdown of statistics, including the number of rows, distinct values, and blanks. For numeric columns, you'll also see the maximum, minimum, and average values. By default, the statistics displayed are based on the first 50 rows in the column. Click the drop down (red arrow below) to increase the number of rows in the preview.
Note: this feature is not available in the Community edition.
In the next panel you'll see a visualization of the column's statistics. By default this is presented in a column cart. Click the Column chart icon (green arrow below) to switch to a bar chart. The chart shows information according to the column type:
- String columns: a chart displaying frequency of text length, and another chart displaying frequency of values.
- Numeric columns: displays a chart showing the frequency of values.
- Date columns: displays a frequency distribution of the date according to the range (i.e. year).
Under Suggested Actions, where relevant you'll see suggested actions you can take:
- Replace outlier with mean: adds a node to the ETL to replace the outlier of the given column with the mean.
- Remove Blanks: adds a filter node to the ETL to remove blanks from the given column.
- Add Time Intelligence: adds a Time Intelligence node to the ETL to separate a given dateKey column into time intelligence columns.